
In my previous post I had explained the structure of SCSI-FCP and NVMe/FC I/Os between hosts and storage connected via a FC-SAN. Continuing on the same, lets us take a quick look at how Cisco SAN Analytics solution helps track the I/O performance related parameters on 32G MDS FC switches.
A Data Center application is said to have a performance issue when the application slows down for no apparent reason. These are one of the toughest category of problems to troubleshoot. Today, admins use common APM (Application Performance Monitoring) tools (Eg: Cisco AppDynamics) or Application specific tools (Eg: SQL Perf monitor) for monitoring App performance. The APM tools build out application dependency graphs and can help the admin zoom in to the specific application/server having performance issues by tracking their latency characteristics. If the issue happens to be due to external block storage access (Eg: A Database server took more than the normal amount of time to service requests), then the focus would shift to monitoring the I/O performance of the specific server impacted. If the server admin does not find anything abnormal, the SAN admin comes into picture. The SAN Admin has to:
- Look at fabric monitoring tools (Eg: DCNM) for any congestion events in FC switches that can impact storage performance.
- Identify storage array ports and LUNs and use the storage array vendor provided performance monitoring tools.
Seems like a good troubleshooting workflow with the Storage Admin task cut out? Wait! Lets dig a bit deeper into this.
First, in a large enterprise FC-SAN there are a multitude of storage arrays from different vendors with LUNs provisioned across the storage infrastructure. Typically, the storage volumes presented to application servers are pooled from multiple storage arrays so as to share the I/O load. So monitoring the storage means scrambling across various vendor tools across the entire infrastructure looking for LUN performance. Not only does the admin have to comprehend different look-n-feel of these tools but also be aware of nuances of how exactly each vendor quantifies his storage performance. The lack of single pane of glass for monitoring results in more touch points which is cumbersome and error prone. A storage admin is likely to face practical issues like:
- Not all storage array tools offer visibility into LUN level performance. (Eg: A Vendor-X tool supports LUN performance metric for only one family of their Storage Arrays).
- There is no standard set of LUN performance benchmarking parameters used by vendors and is array architecture specific (Eg: Vendor-X may measure LUN performance at the array front-end ports and Vendor-Y may measure it at the back end-ports). So it is very hard for a Storage Admin to say if the DB server is suffering due to LUN provisioned on vendor-X Array or the vendor-Y Array.
- If the LUN performance metric is not looking good, there is no next level visibility as to which type of I/Os are having an impact. Most tools today do not distinguish Read vs Write I/O either.
- Most NVMe arrays are brand new and performance monitoring is not yet supported on them.
[Note: For simplicity, rest of the post only considers SCSI protocol and LUN access. The same would apply to NVMe protocol and NameSpace accesses as well]
This is where the Cisco SAN Analytics comes into the picture. It measures several metrics (including performance metrics) from the I/Os in flight in the fabric. The I,T,L tuple (InitiatorPort, TargetPort, LUN) is extracted from the frame FC and SCSI headers being switched in the hardware. The SCSI level CMD_IU, DATA_IU, XRDY_IU, RSP_IU are parsed for computing a variety of metrics separately for READ and WRITE I/O. These metrics help in better correlation and trend identification of FC storage traffic.
The following are the unique features of this solution:
- A storage vendor neutral monitoring of I/O performance in FC-SANs
- A “man in the middle” approach to I/O performance measurement across the entire storage infrastructure independent of storage vendor.
- A common performance measurement platform for consistent comparison of I/O performance across various vendor storage arrays.
- An I/O performance measure that is much closer to what an application on the sever (host) is likely to see.
- A simple on-demand metrics collection enablement on a per-switch port basis.
- A total of about 70+ metrics per-ITL, per-port.
- Support for SCSI-FCP and NVMe/FC protocols.
The MDS SAN Analytics requires 32G FC hardware. The metrics can be captured on any 32G capable switch port in the fabric in the path between host and storage. The three modes of enablement are shown below. Note that it is not required for the entire fabric to be at 32G.

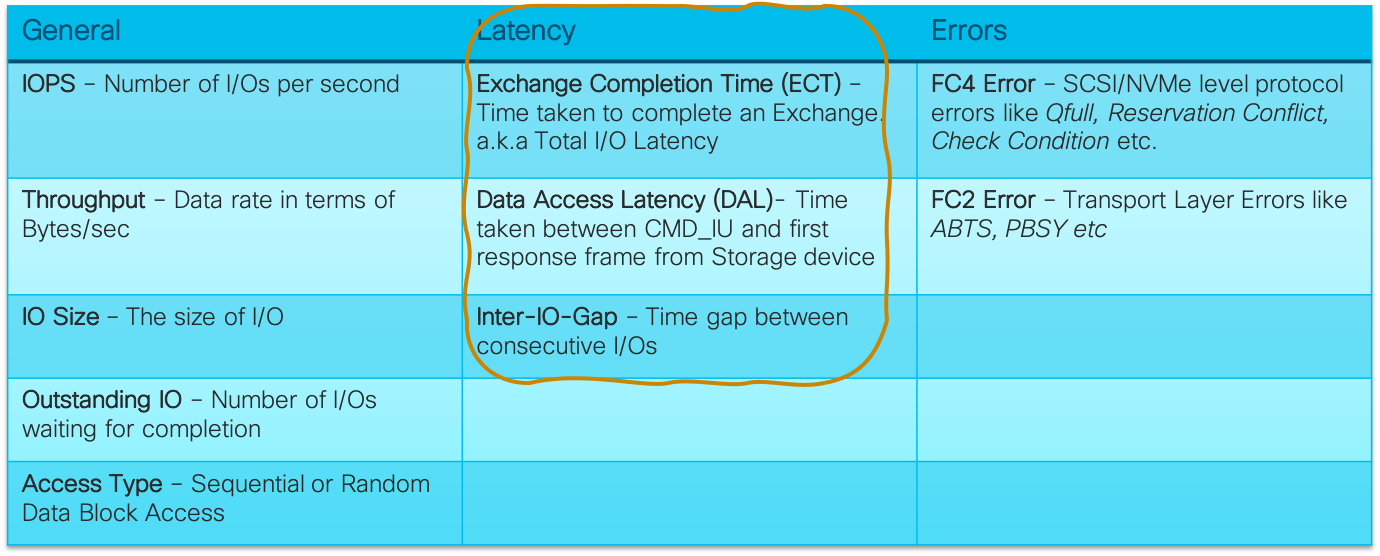
With every director switch capable of tracking upto 40K ITLs (fabric switch 20K), there would be an exhaustive set of metrics for the FC-SAN. The metrics are categorised into three broad categories as shown below. For each of these metric Min/Max/Average are separately computed. I focus only on the Latency metrics in this post.
A high latency for I/Os can become the limiting factor for application performance. In particular, certain class of applications that are real-time or short-transactional in nature(Eg:OLTP) are highly sensitive to latency. For these applications, I/O response times have to be extremely low to give best performance and end-user experience. Several techniques like caching, delayed flush, indexing tables etc are setup on the server/storage systems specifically to deliver the desirable latency numbers.
Let us now do a bit of deep dive into SAN Analytics latency metrics which are primarily used to measure I/O performance.
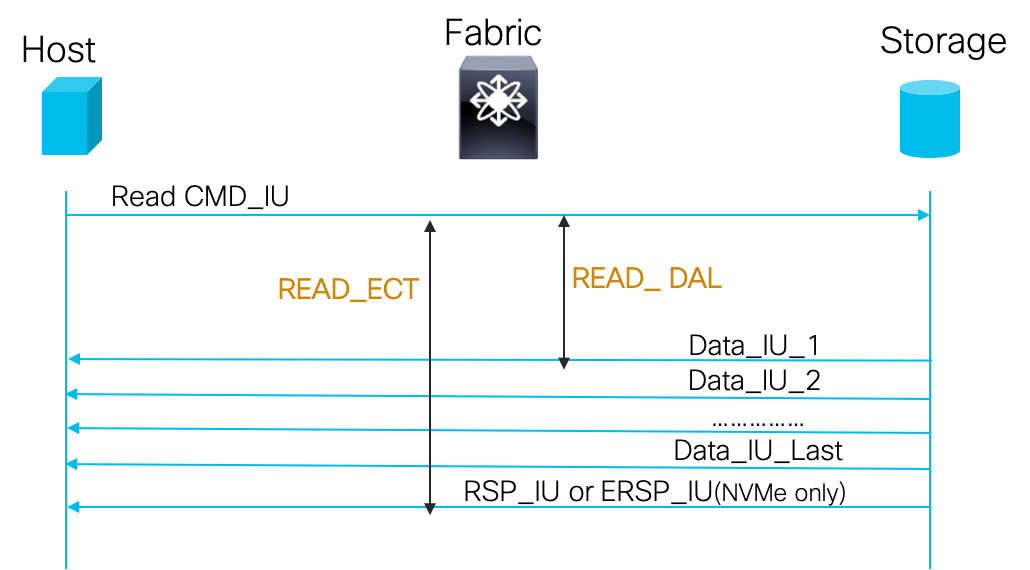
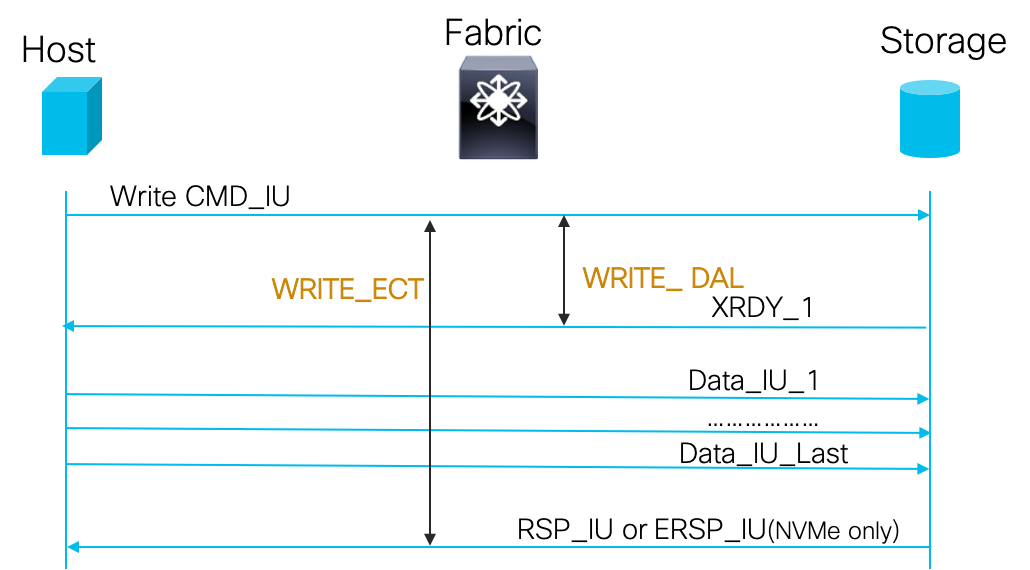
- ECT (Exchange Completion Time): In FC parlance, there is a one-one relationship between an I/O and an Exchange. Hence I/O latency is equivalent to the time it takes to complete an Exchange. i.e ECT = time delay from a CMD_IU to the RSP_IU. This metric has a direct correlation to the latency experienced by host applications for I/O. Generally host applications are assigned to a storage LUN based on a storage performance tier system. (Eg: Response times < 5ms = Tier1; 5-100ms = Tier2; > 100ms=Tier3). Even within a Tier, applications have specific expectations (Eg: MS-SQL classifies latency as Good: < 10ms; Okay: 10–20ms; Bad: 20–50ms; Seriously Bad: > 50ms). Tracking the Avg and Max ECT values for a set of Application ITLs against what is expected by the application can give advance warnings about an upcoming application performance impact.
- DAL (Data Access Latency): This is the time delay from a CMD_IU to first DATA_IU (for READ) or first XRDY_IU (for WRITE). This metric gives the storage initiation delay component in the overall response time. Storage Arrays typically queue the incoming command requests and service it only after allocating resources (buffers, DMA resources). Computation constraints on the storage array like a busy Storage Processor or resource constraints like low memory would mean there are delays in servicing commands and DAL gives an indication of this. An analysis of ECT and DAL together can be very powerful. As a generic rule of thumb, if DAL and ECT increase in tandem it is a storage array issue; else it is a host or fabric issue.
-
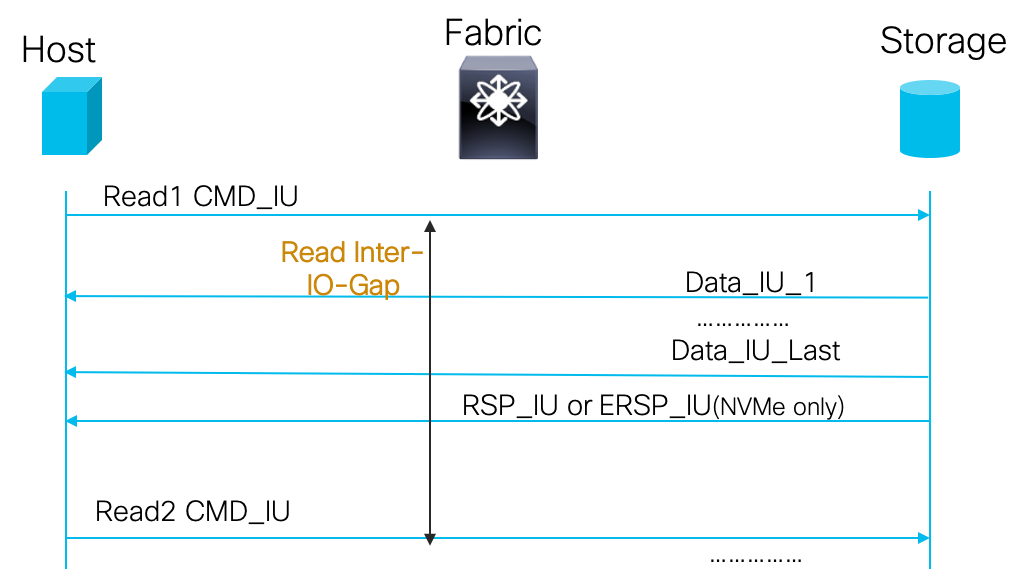
Inter-IO-Gap: The time delay between two consecutive I/O commands i.e time between a CMD_IU and the next CMD_IU. This metic can help characterise the I/O burst profile. Most of todays slow drain conditions happen in the fabric when a certain application I/O traffic profiles are “bursty” (Eg: A host reads too much data in a short period of time and the FC port operating speed does not allow it to drain responses fast enough). This metric can help characterise such end-device behaviours and help pinpoint I/O patterns that are the root cause.
The above three classes of latency parameters results in about 12 distinct latency metrics per ITL and can be considered an exhaustive set compared to none or just the LUN latency metric available from storage vendor tools.
The above latency metrics can be used to solve a variety of customer performance related use-cases with a simple “side-by-side” visual analysis of their trend over time as illustrated by a real world example below:
 Further, MDS switches collect a variety of per-port performance metrics in hardware to give an overall traffic health indicator. They are:
- tx_BBZ, rx_BBZ: Incremented once if there is a frame to send/receive on a port but there are no credits available (transition counter)
- tx_Wait, rx_Wait: Incremented once for every 2.5us of a tx_BBZ/rx_BBZ condition.
- tx_bbcredit, rx_bbcredit: Live tx/rx credits available on a port. When this drops to 0, tx_BBZ/rx_BBZ increments once.
- avg_credit_delay: Live average frame_tx credit availability delay.
- no_credit_avail_count: Incremented when tx credit not continuously available for a configurable period (100ms)
- early_no_credit_drop_count: Incremented for all force drop tx frames with no credit for a configured time period (200ms)
- timeout_drop_count: Tx_packets that were dropped due to wait time exceeding configurable max hold time (500ms)
- tx_datarate, rx_datarate: Live average traffic rate on the port
The above metrics in combination with the I/O Latency metrics would give unmatched levels of visibility into I/O performance of MDS FC-SANs.
All the above categories of performance metrics can also act as triggers to detect fabric congestion and take mitigation actions as described in one of my previous posts.
I assume now you have a high level idea of the “what” of SAN performance measurement with MDS SAN Analytics. I did not cover the “how” part of solution that includes the configuration, show CLI commands on the MDS switches and the proactive performance monitoring features of DCNM SAN Insights like ECT Learning, Baselining, Deviation tracking etc. This topic would require a separate blog post of its own.
More information on SAN Analytics solution is available in the solution configuration guide here.
As usual, If you have any questions or comments, please do post them in the comments section below. Ciao all till my next post. Take care and stay safe!
Authors
5 Comments
The Cisco MDS 9396T switch provides high-speed connectivity in the SAN. This switch offers superior analytics and telemetry capability built into its ASIC – https://typhoon-tv.com/typhoon-tv-apk-download/
The SAN Analytics solution provides insights into your fabric by allowing you to monitor, analyze, identify, and troubleshoot performance issues
https://vivatvapk.co/
The same analogy can be applied to Cisco's industry-unique solution: SAN Analytics for Cisco MDS 9000 series switches. https://vivatvapk.co/download/
Thanks for the valuable information.
https://unlockmytv.fun/unlockmytv-apk-download/
Very informative and useful. Great job!