Note: The following is the third of a three-part technical blog series focusing on some of the main use cases behind Cisco DNA Center – the network management, command center, and analytics platform for Cisco DNA (Digital Network Architecture)
In my first and second blog posts on Cisco DNA Center, I focused on base automation use cases sharing examples of both day 0 and day N operations; now it’s time to focus on a topic near and dear to every organization—the user experience. Based on my conversations with customers, it is in every network administrator’s best interest to provide a good experience to their end users, and this is where Cisco DNA Center Assurance comes in.
The overall goal of Cisco DNA Center Assurance is simple yet very powerful: to provide greater visibility into what’s happening in the network and to find and solve problems faster. If you think about it, in order to guarantee a good experience for users, we need to have visibility and line of sight from the client perspective. This poses a few questions…
- Can clients onboard in the network?
- If they are able to onboard, how is the quality of their connectivity?
- Is a single user having a specific problem or isolated issue, or that problem is affecting a whole floor or a site?
If we can get this data presented in a dashboard via Cisco DNA Center without having to issue any commands manually, we are already ahead of the game. However, only looking at client data provides a very limited view and does not really give us the whole picture; we also need to understand what’s happening with the network devices and how they are performing. Finally, the last piece of the puzzle is visibility into the applications. Understanding which applications are being used within the network, how the applications are behaving and how they are being accessed will give us a complete landscape and 360 degree view of how the network is servicing the users.
Cisco DNA Center Assurance Health Dashboards
For this purpose, Cisco DNA Center Assurance provides dashboard views providing deep, contextual insights from the three different lenses: client health, network health and application health.

Cisco DNA Center Assurance Dashboards & Overall Health Dashboard showing network and client health

Application Health dashboard
Turn Your Data into Intuition
Having visibility into who and what is on the network can bring tremendous value to organizations but if the information is overwhelming or not presented in a way that’s easy to consume, then it doesn’t serve the right purpose—and ultimately becomes meaningless from an IT or business perspective. For this reason, Cisco DNA Center Assurance uses the concept of ‘health’ to provide a clear indicator on what’s happening with all connected devices, clients and applications and is then assigned a health score calculated based on KPI’s (Key Performance Indicators). This score is presented in a consistent color-coded way where green indicates good health, orange means fair health, and red tells us there are problems that require attention.
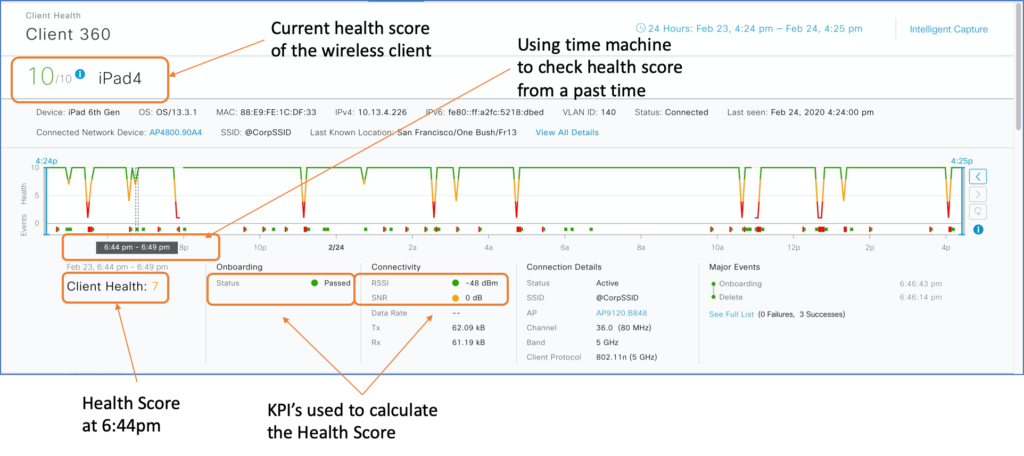
In the snapshot to your right, we are using the “Client 360” dashboard to check the health of a client. The client is currently in good health but the network is able to pinpoint problems in the past. We can use the slide bar to go back in time. We can see that the client health degraded at 6:44pm based on the SNR (Signal to Noise Ratio) KPI:

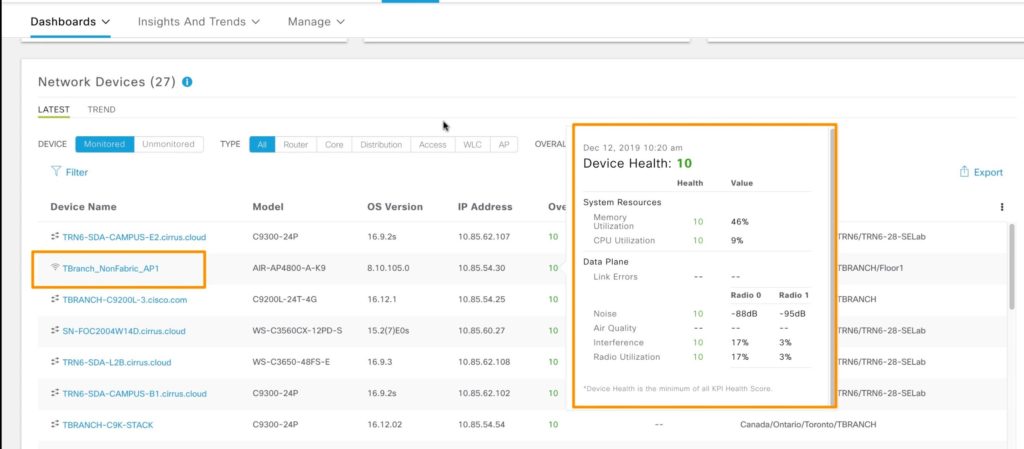
In the snapshot below, we can see the example of the health score of an access point. The current health score has a value of “10” and color-coded in green. We can also see the different KPI’s used to calculate such health score like memory and CPU utilization, noise, interference, etc. The network administrator can easily identify the KPI’s used for the health score calculation, since they are shown in color as opposed to a black number or dash symbols:

Example of device health score showing the KPI’s used to calculate such health score
Identify and Troubleshoot Network Issues Faster
When there is a service outage, or performance degradation on the network you need to move fast to identify and fix the root cause. This isn’t always an easy task! At least traditionally.
With Cisco DNA Assurance, these issues include a comprehensive description of the problem (and exactly where it’s happening), followed by a set of guided remediation steps for resolution. Now, one could think that an issue is no different than an alarm…but that’s not really the case here. An issue is created based on aggregated datasets and powerful correlation capabilities that have been programmed into Cisco DNA Center, with the ability to detect more than 170 problems both in wireless and wired environments (available in current release of Cisco DNA Center).

Example of an open issue with its description and guided remediation
The Power of ML/AI network analytics
When trying to identify anomalies in the network we typically use thresholds so that if those thresholds are crossed, that could be an indication of a problem. However, there are certain environments such as wireless that are dynamic in nature, and could benefit from dynamic baselines to make anomaly detection more relevant to different environments. Baselining is a method used to analyze network dynamics to extract behavioral patterns that help define what is the “normal”—aka baseline—behavior for that specific network. The actual network performance is then compared with that baseline which helps the network administrator to identify problems in the network and quickly detect deviations. AI-Driven baselining is one of the benefits of Cisco DNA Center Assurance ML/AI (Machine Learning and Artificial Intelligence) network analytics.
Using artificial intelligence statistical modeling, these baselines learn and adapt as the network environments change and as the number of devices, users, and applications continue to evolve. By determining a baseline range for network activity—error rates, onboarding times, application performance, for example—this helps spotlight relevant deviations in behavior that impact network availability.

Dynamically generated “Green Band”, expected normal range of client experience
Determining the health of wireless networks
Another area that seems to be challenging for network administrators is how to reproduce wireless client problems with association and connectivity. This is especially true if the clients are having problems in remote locations. The Cisco 1800S sensors together with DNA Center Assurance sensor dashboards can help!
An active sensor is a small device that is used to run specific tests that leverage synthetic traffic to mimic a wireless LAN client in order to identify onboarding and connectivity issues in the network in real time without requiring an onsite IT technician.

Cisco 1800S active sensor photo shown on top of a switch for size perspective
Network administrators can deploy these small devices in different areas of the network. Sensor tests are programmed using Assurance sensor dashboards, and can run periodically or when specific troubleshooting is needed. Numerous tests are supported including network tests (such as wireless onboarding and RF assessment); performance tests (like IP SLA and speed test) and application tests (email or web services).


Sensor dashboards in Cisco DNA Center
My main goal for this blog was to walk you through several Cisco DNA Center Assurance capabilities that can help in your everyday operations, and to further leverage your network as your organization’s biggest strategic asset to guide smarter decisions and better business outcomes. But this is just the tip of the iceberg; Cisco DNA Center Assurance has much more to offer than I could ever fit into a single blog post.
This is the future of networking. Are you ready?
-Lila
Read Part 1
Read Part 2
See how Cisco DNA Assurance can help transform your business. Visit our demos page!
2 Comments


Hi Lila,
Very well written blog. I am sure we would love to add Intelligent Capture for Wireless Client and Real-time AP troubleshooting. Also, our event notification engine that allow customers to integrate Assurance issues into 3rd party ITSM tools.
Regards,
TP
Thanks for this very useful blog and making it easy to follow so any network operator can use and benefit from assurance day 1.