
Segmenting the network with Trustsec policies is extremely flexible and powerful.
This security framework is one of the core pieces of any Cisco SDA fabric, but can be deployed also in a traditional network. In a few clicks, you can have devices isolated or prevented from accessing sensible resources: “Et voilà !”, your network is basically a fully distributed security engine.
While Cisco DNAC or ISE can easily automate the policy definition and the deployment spread on a large number of network devices, there isn’t any management tool available today to monitor effectively where the traffic is blocked or permitted, and which are the source and destination group tags involved in the communication exchanges.
We are going to explore some innovative ways to report potential policy violations and navigate within the data provided by IOS-XE on the Cat9k.
How to monitor Trustsec policies – the traditional way to do it
When defining centrally new SGACLs in ISE, it is possible to specify the “log” option. If done that way, drop or even permitted messages will be sent by syslog.
However, that requires to tune properly the verbosity level: if set too high, the amount of logs sent by all switches will be overwhelming, if set too low, the exercise isn’t interesting anymore. Let’s keep the syslog channel for troubleshooting purposes, and investigate another method for providing statistical reporting.
A more appealing visualisation tool – Elasticsearch & Kibana
On every switch enforcing SGACLs, there is a command line providing some high level view about traffic counters: for each pair of SG Tags, we get the corresponding number of permitted or denied packets.
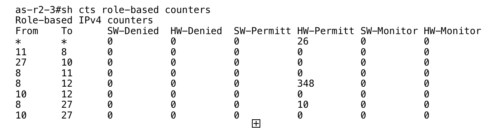
The idea is to translate this local table taken out from a single switch into a global view, presented within a graphical interface. Elasticsearch and Kibana are typically the tools we can use to achieve elegantly that task.
Once stored into Elasticsearch, Kibana can extract and display the data, and additionally, allows to perform drill down manipulations very easily. That is the perfect exemple how we can manipulate and display in a structured way a large amount of information.
Distributed processing with Python scripts
Instead of sending raw messages to be managed centrally, we are going to distribute the initial processing and publish the data over TCP to the machine running the Elasticsearch database.
On a Catalyst 9K, it is possible to activate a linux container and benefit from python scripting to run our data processing: that exactly what we are going to leverage.
- A simple Event Manager configuration with a crontab entry will start our python script every 5 minutes.
- The python script stored on the flash will be executed inside the “guestshell” container, will run the cli instructions, will convert the output into structured records, and will push them remotely to the host running Elasticsearch. Once executed, the SGT counter is cleared.
- To display the recorded data, we will use Kibana, and we will prepare a few visualisation dashlets to be grouped into a meaningful dashboard.
Below is the description of the required steps to achieve this setup :
Step1 : Enabling the guestshell container on the Cat9k
The container framework is activated by adding the “iox” keyword in the configuration.
Once done, wait for one or two minutes until it is activated ; you can check the availability with the “show iox-service” command :
as-r2-3#sh iox-service
IOx Infrastructure Summary:
---------------------------
IOx service (CAF)    : Running
IOx service (HA)     : Running
IOx service (IOxman) : Running
Libvirtd             : Running
To create the “guestshell” container, a single command is required : “guestshell enable”.
However, before to start the iox framework and instantiate the guestshell, you need to specify how the container will access the network. Starting with 16.11, you can map the single “eth0” guestshell interface to a vlan present on the switch. The IP address of the container is defined in the switch configuration, there isn’t any way to change it from inside the guestshell… Below, the eth0 guestshell interface is bound to the vlan 690, and set to the 172.16.90.101 IP address with 172.16.90.1 as the gateway.
app-hosting appid guestshell
 app-vnic AppGigEthernet vlan-access
  vlan 690 guest-interface 0
   guest-ipaddress 172.16.90.101 netmask 255.255.255.0
 app-vnic management guest-interface 0
 app-default-gateway 172.16.90.1 guest-interface 0
Step 2 : Installing the Elasticsearch python library inside the container
To ease the communication with the ElasticSearch database, we are going to use an add-on python library ; From the switch CLI, we connect first to the guestshell, and we install the library with “pip”, as usually done in Linux.
We have got network connectivity from Step #1, but to get “pip” working, we need access to the DNS too. We can add the nameserver configuration once logged into the guestshell (with the “guestshell run bash” IOS command) :
as-r2-3#guestshell run bash
[guestshell@guestshell ~]$
[guestshell@guestshell ~]$ sudo bash
[root@guestshell guestshell]# echo "nameserver 8.8.8.8" >>/etc/resolv.conf
Now, we can install the Elasticsearch API library by invoking “pip” :
[guestshell@guestshell ~]$ sudo pip install elasticsearch
Collecting elasticsearch
  Using cached https://files.pythonhosted.org/packages/ae/43/38329621bcca6f0b97e1cc36fb3cef889414a1960fcdc83a41e26b496634/elasticsearch-7.0.2-py2.py3-none-any.whl
Requirement already satisfied: urllib3>=1.21.1 in /usr/lib/python3.5/site-packages (from elasticsearch) (1.25.3)
Installing collected packages: elasticsearch
Successfully installed elasticsearch-7.0.2
[guestshell@guestshell ~]$
As long as we don’t “destroy” the guestshell (# guestshell destroy), the python library will remain installed.
Step 3 : Copying the python script on the switch and scheduling the execution
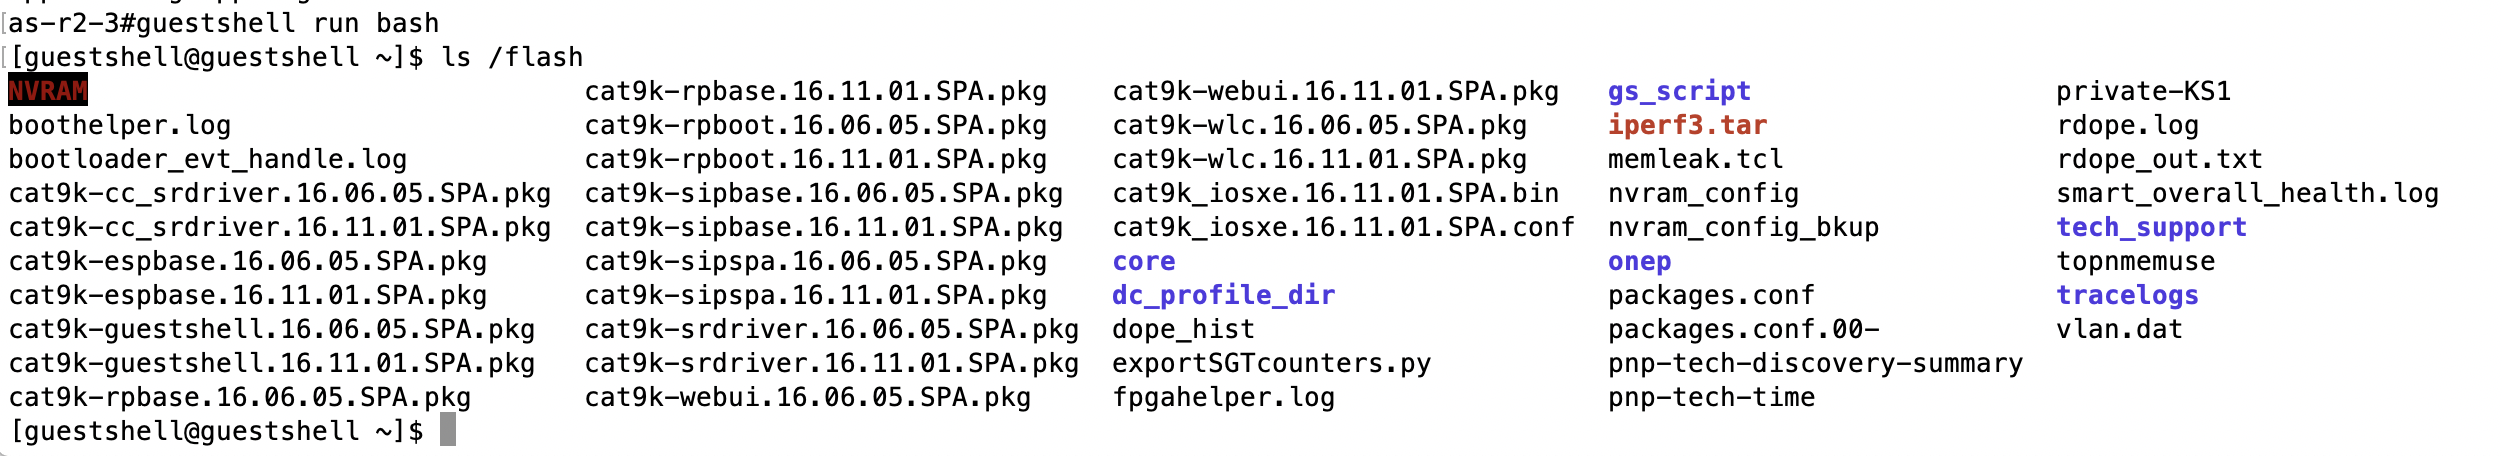
Even if we execute python within the guestshell container, the python script file can remain stored on the bootflash, as other configuration files.
An example of this script can be downloaded from github here : https://github.com/jnfrncs/exportSGTcounters
To launch manually the script from the switch CLI (once copied into the flash), you can execute it that way :
as-r2-3# guestshell run python /flash/exportSGTcounters.py
The file location refers to the Linux syntax, because the file name is an argument passed to the python command inside the container. That means the switch bootflash is accessible from the container as the “/flash” directory mount point.
Step 4 : Setting up the scheduler
We have seen how the script can be launched manually, but we want it to be executed every 5mn.
It can be done easily with Event Manager (EEM) :
as-r2-3#sh run | sec event manag
event manager applet exportSGACLcounters
 event timer cron name exportSGACLcounters cron-entry "*/5 * * * *"
 action 1.0 cli command "enable"
 action 1.1 cli command "guestshell run python /flash/exportSGTcounters.py"
 action 1.2 cli command "quit"
Step 5 : Tuning a bit the index of the Elasticsearch database
If you use the script as is, the records are inserted into the Elasticsearch database with the “sgacls” index name (ELASTIC_INDEX=‘sgacls’ variable defined in the script). To visualise the data in Kibana, you need to create an “index” with the name used to store the records. Each entry is parsed and gets automatically its data type, so it can be indexed efficiently. Unfortunately, counters and dates are sometimes identified as “strings”, which doesn’t allow to sum up counters or display data properly on a timeline.
To avoid this, and before to create the index in Kibana, we need to force the data type with an Elasticsearch API (this is the “mapping” process). You have do it only once when creating the index, and it can be done with “Postman”, or “Paw” on my Mac.
The API request for adjusting the mapping would look like this :
PUT /sgacls HTTP/1.1
Content-Type: application/json; charset=utf-8
Host: rollux.rollelab.ch:9200
User-Agent: Paw/3.1.8 (Macintosh; OS X/10.14.5) GCDHTTPRequest
Content-Length: 303

{"mappings":{"counters":{"properties":{"from":{"type":"text"},"hw-denied":{"type":"integer"},"hw-monitor":{"type":"integer"},"hw-permitt":{"type":"integer"},"sw-denied":{"type":"integer"},"sw-monitor":{"type":"integer"},"sw-permitt":{"type":"integer"},"to":{"type":"text"},"datetime":{"type":"date"}}}}}
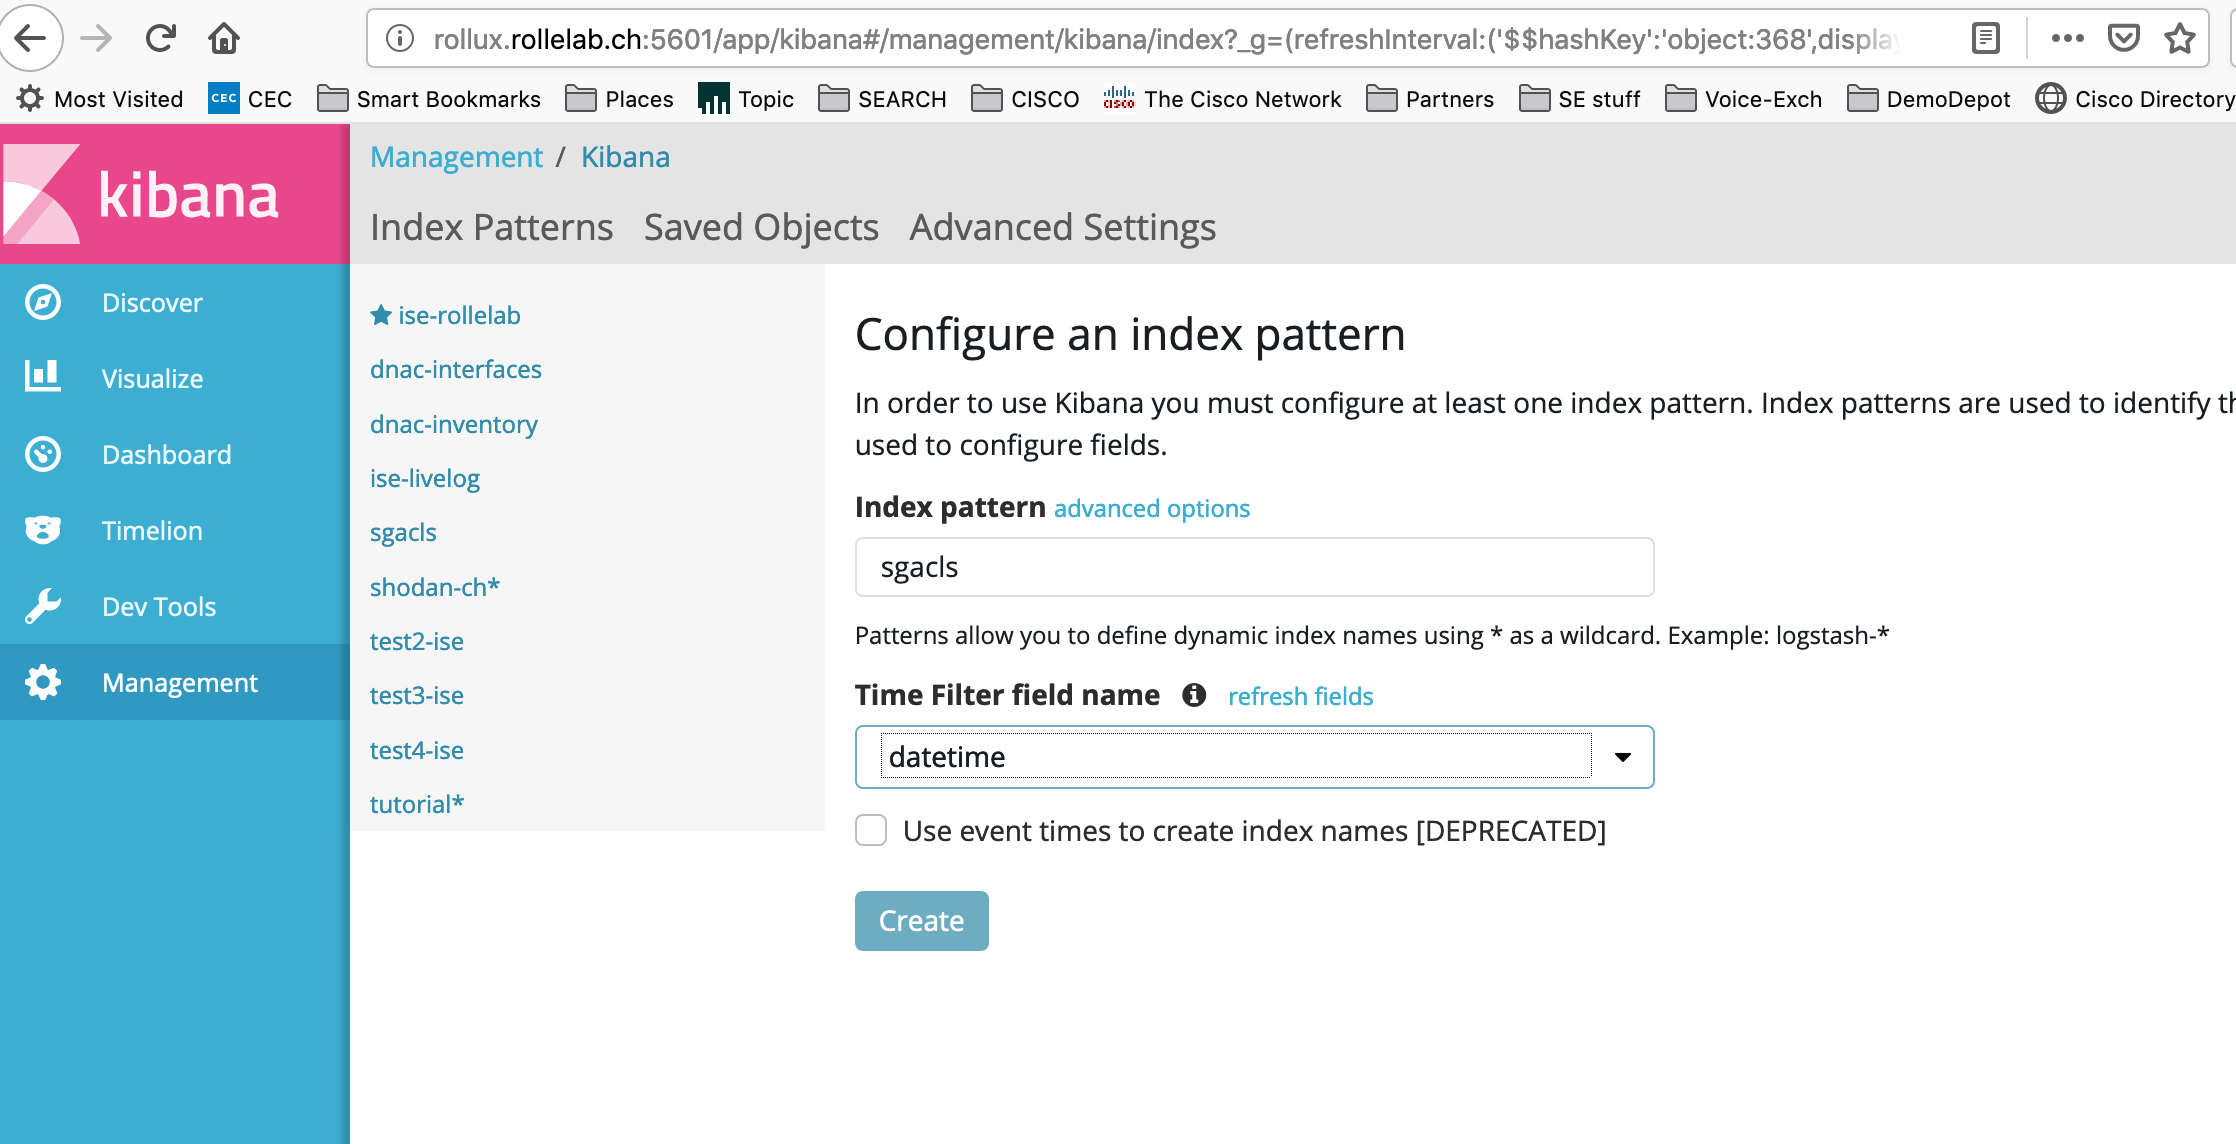
Step 6 : Creating views with Kibana
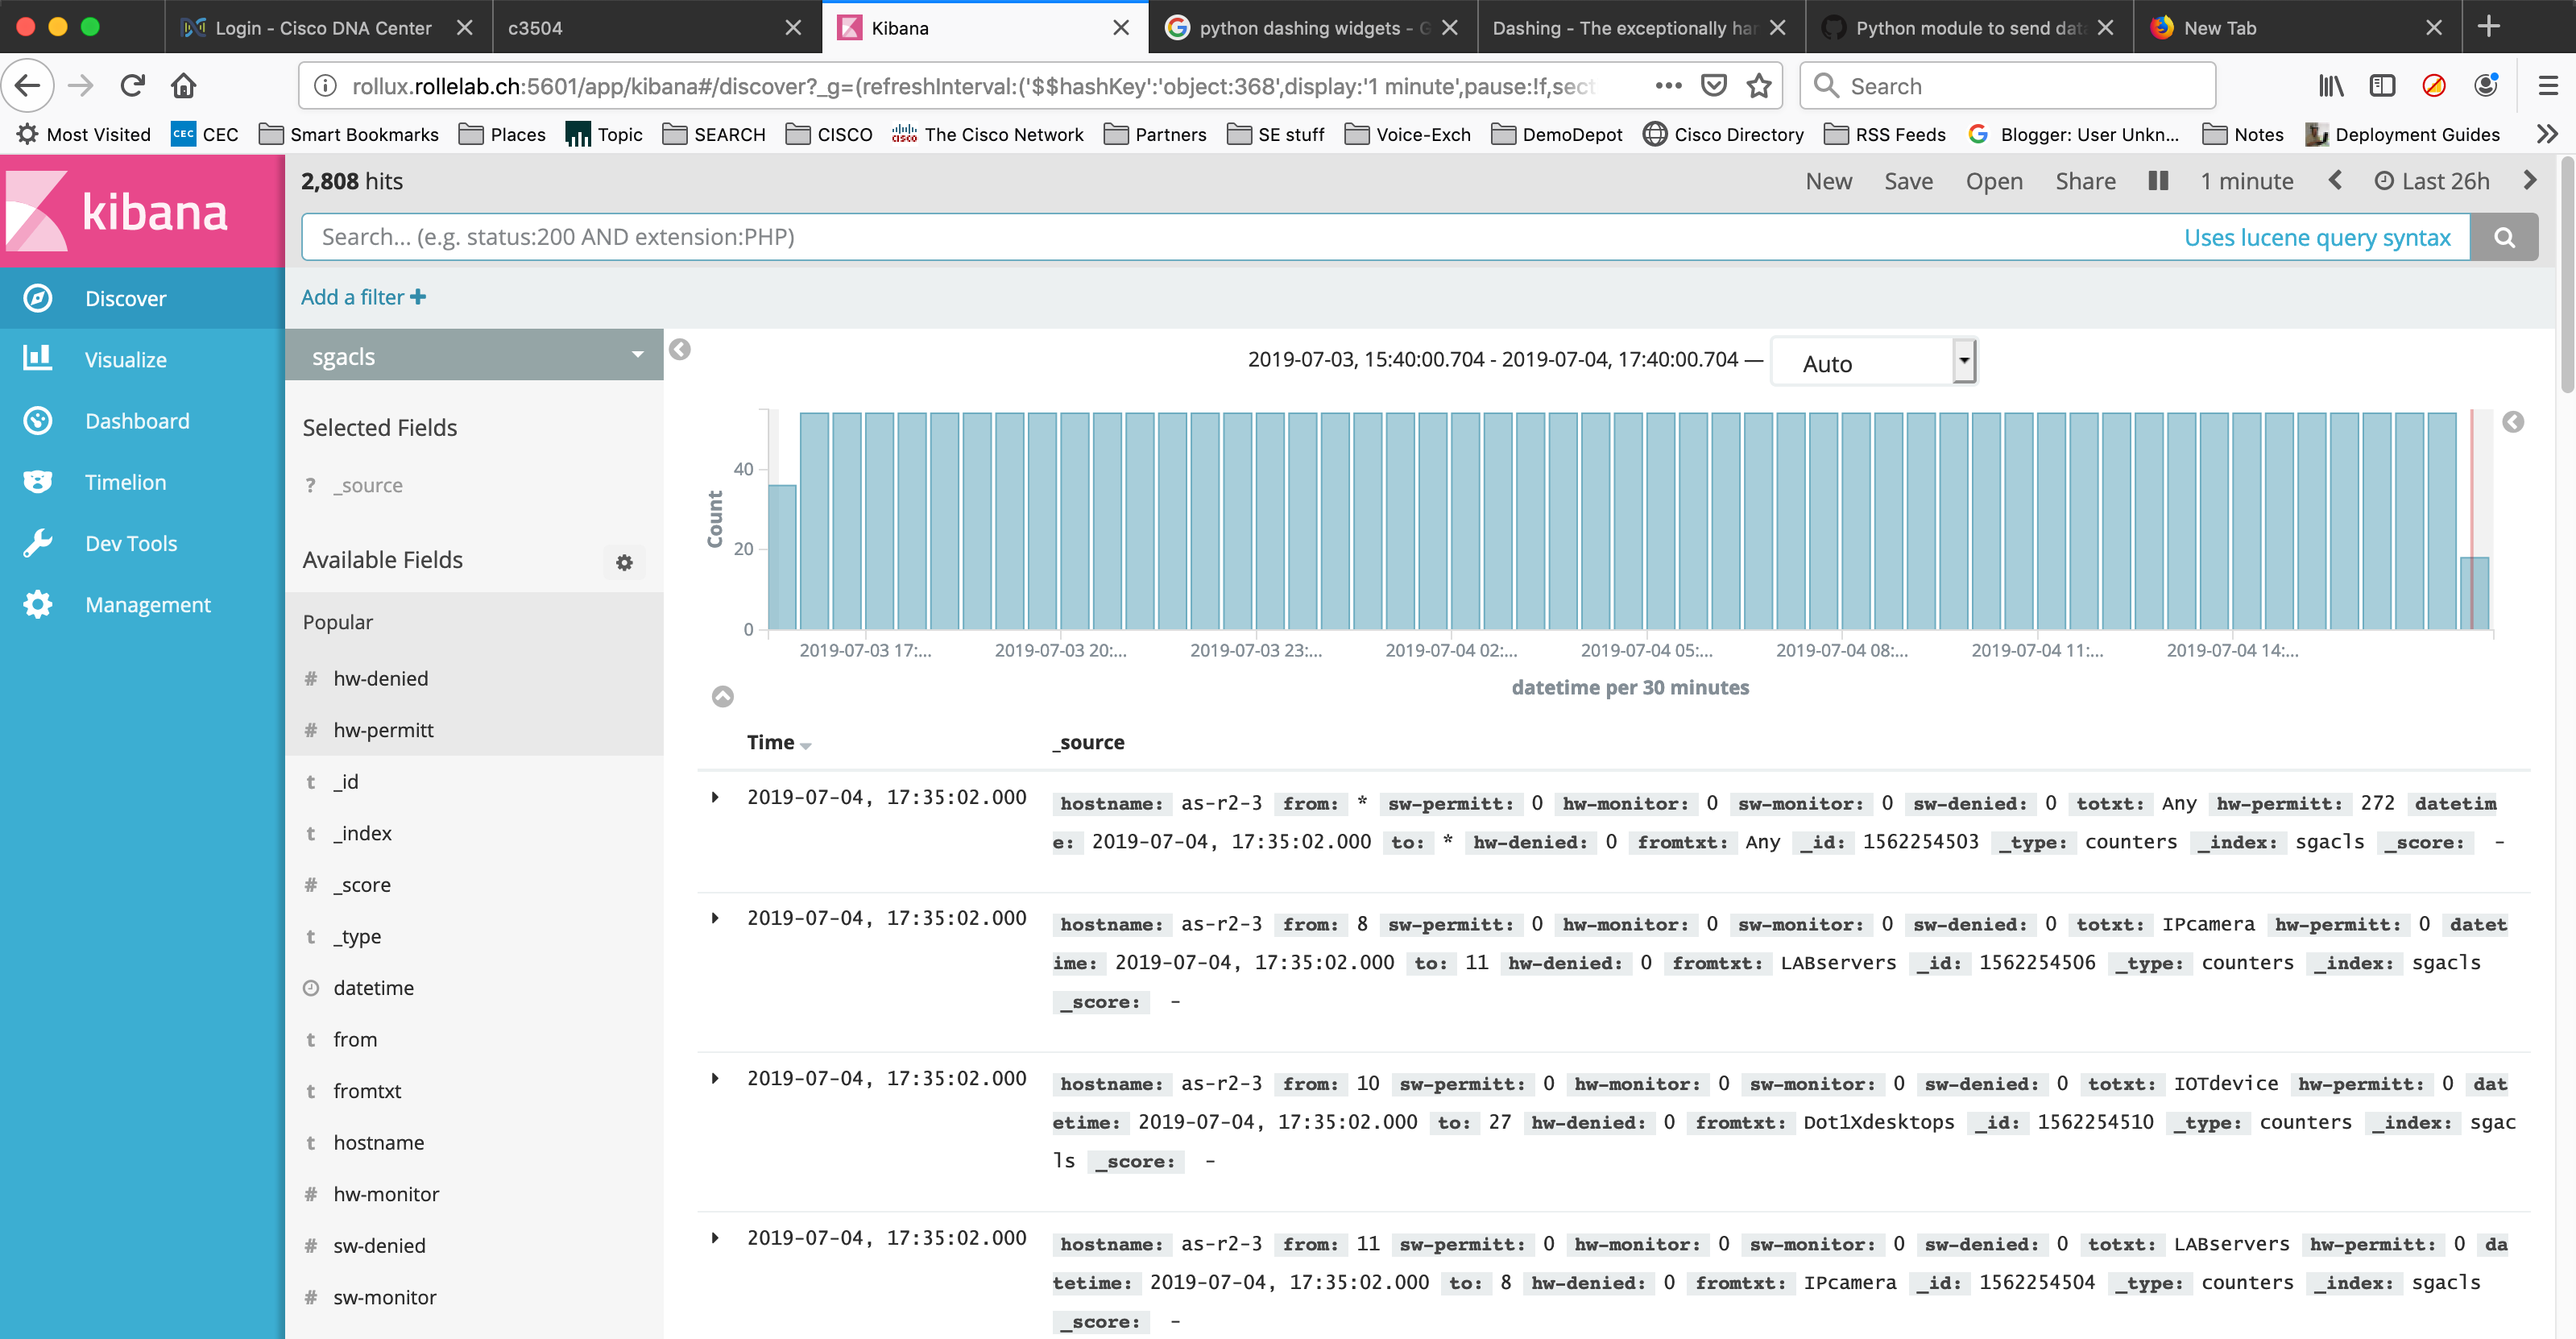
Once the mapping is correct, we can finalise the index mapping in Kibana. You have to create a new “index pattern” from the management menu, with the name you used in the python script to post the records (“sgacls”) ; the date is recorded in the “datetime” field, so we can specify that parameter, too.
Once done, you can see all records ordered by time in the “Discover” page :
If that looks good, you can create a dashlet by using the “Visualize” menu : 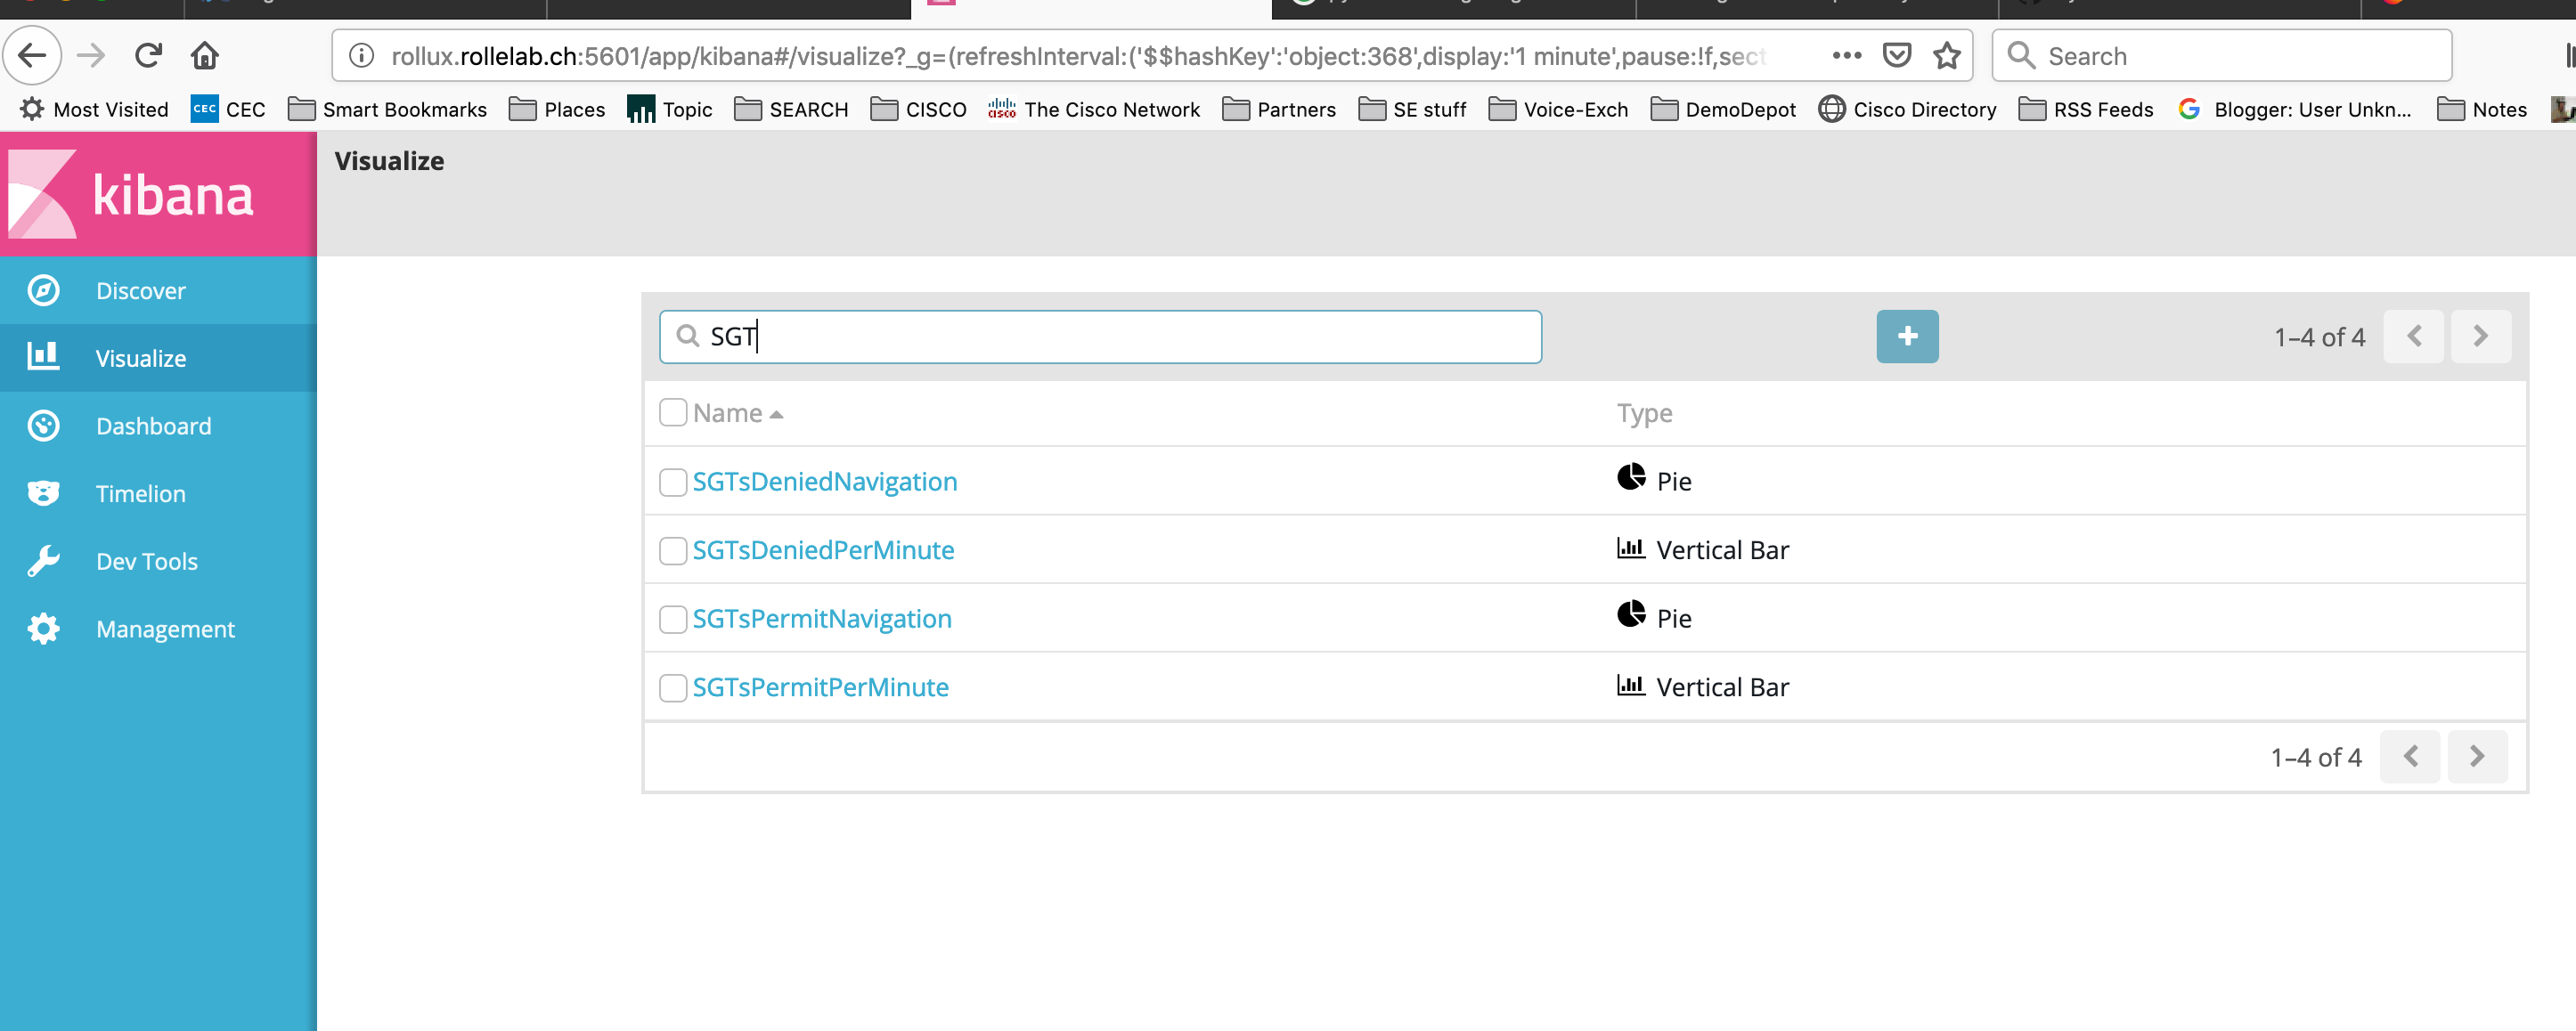
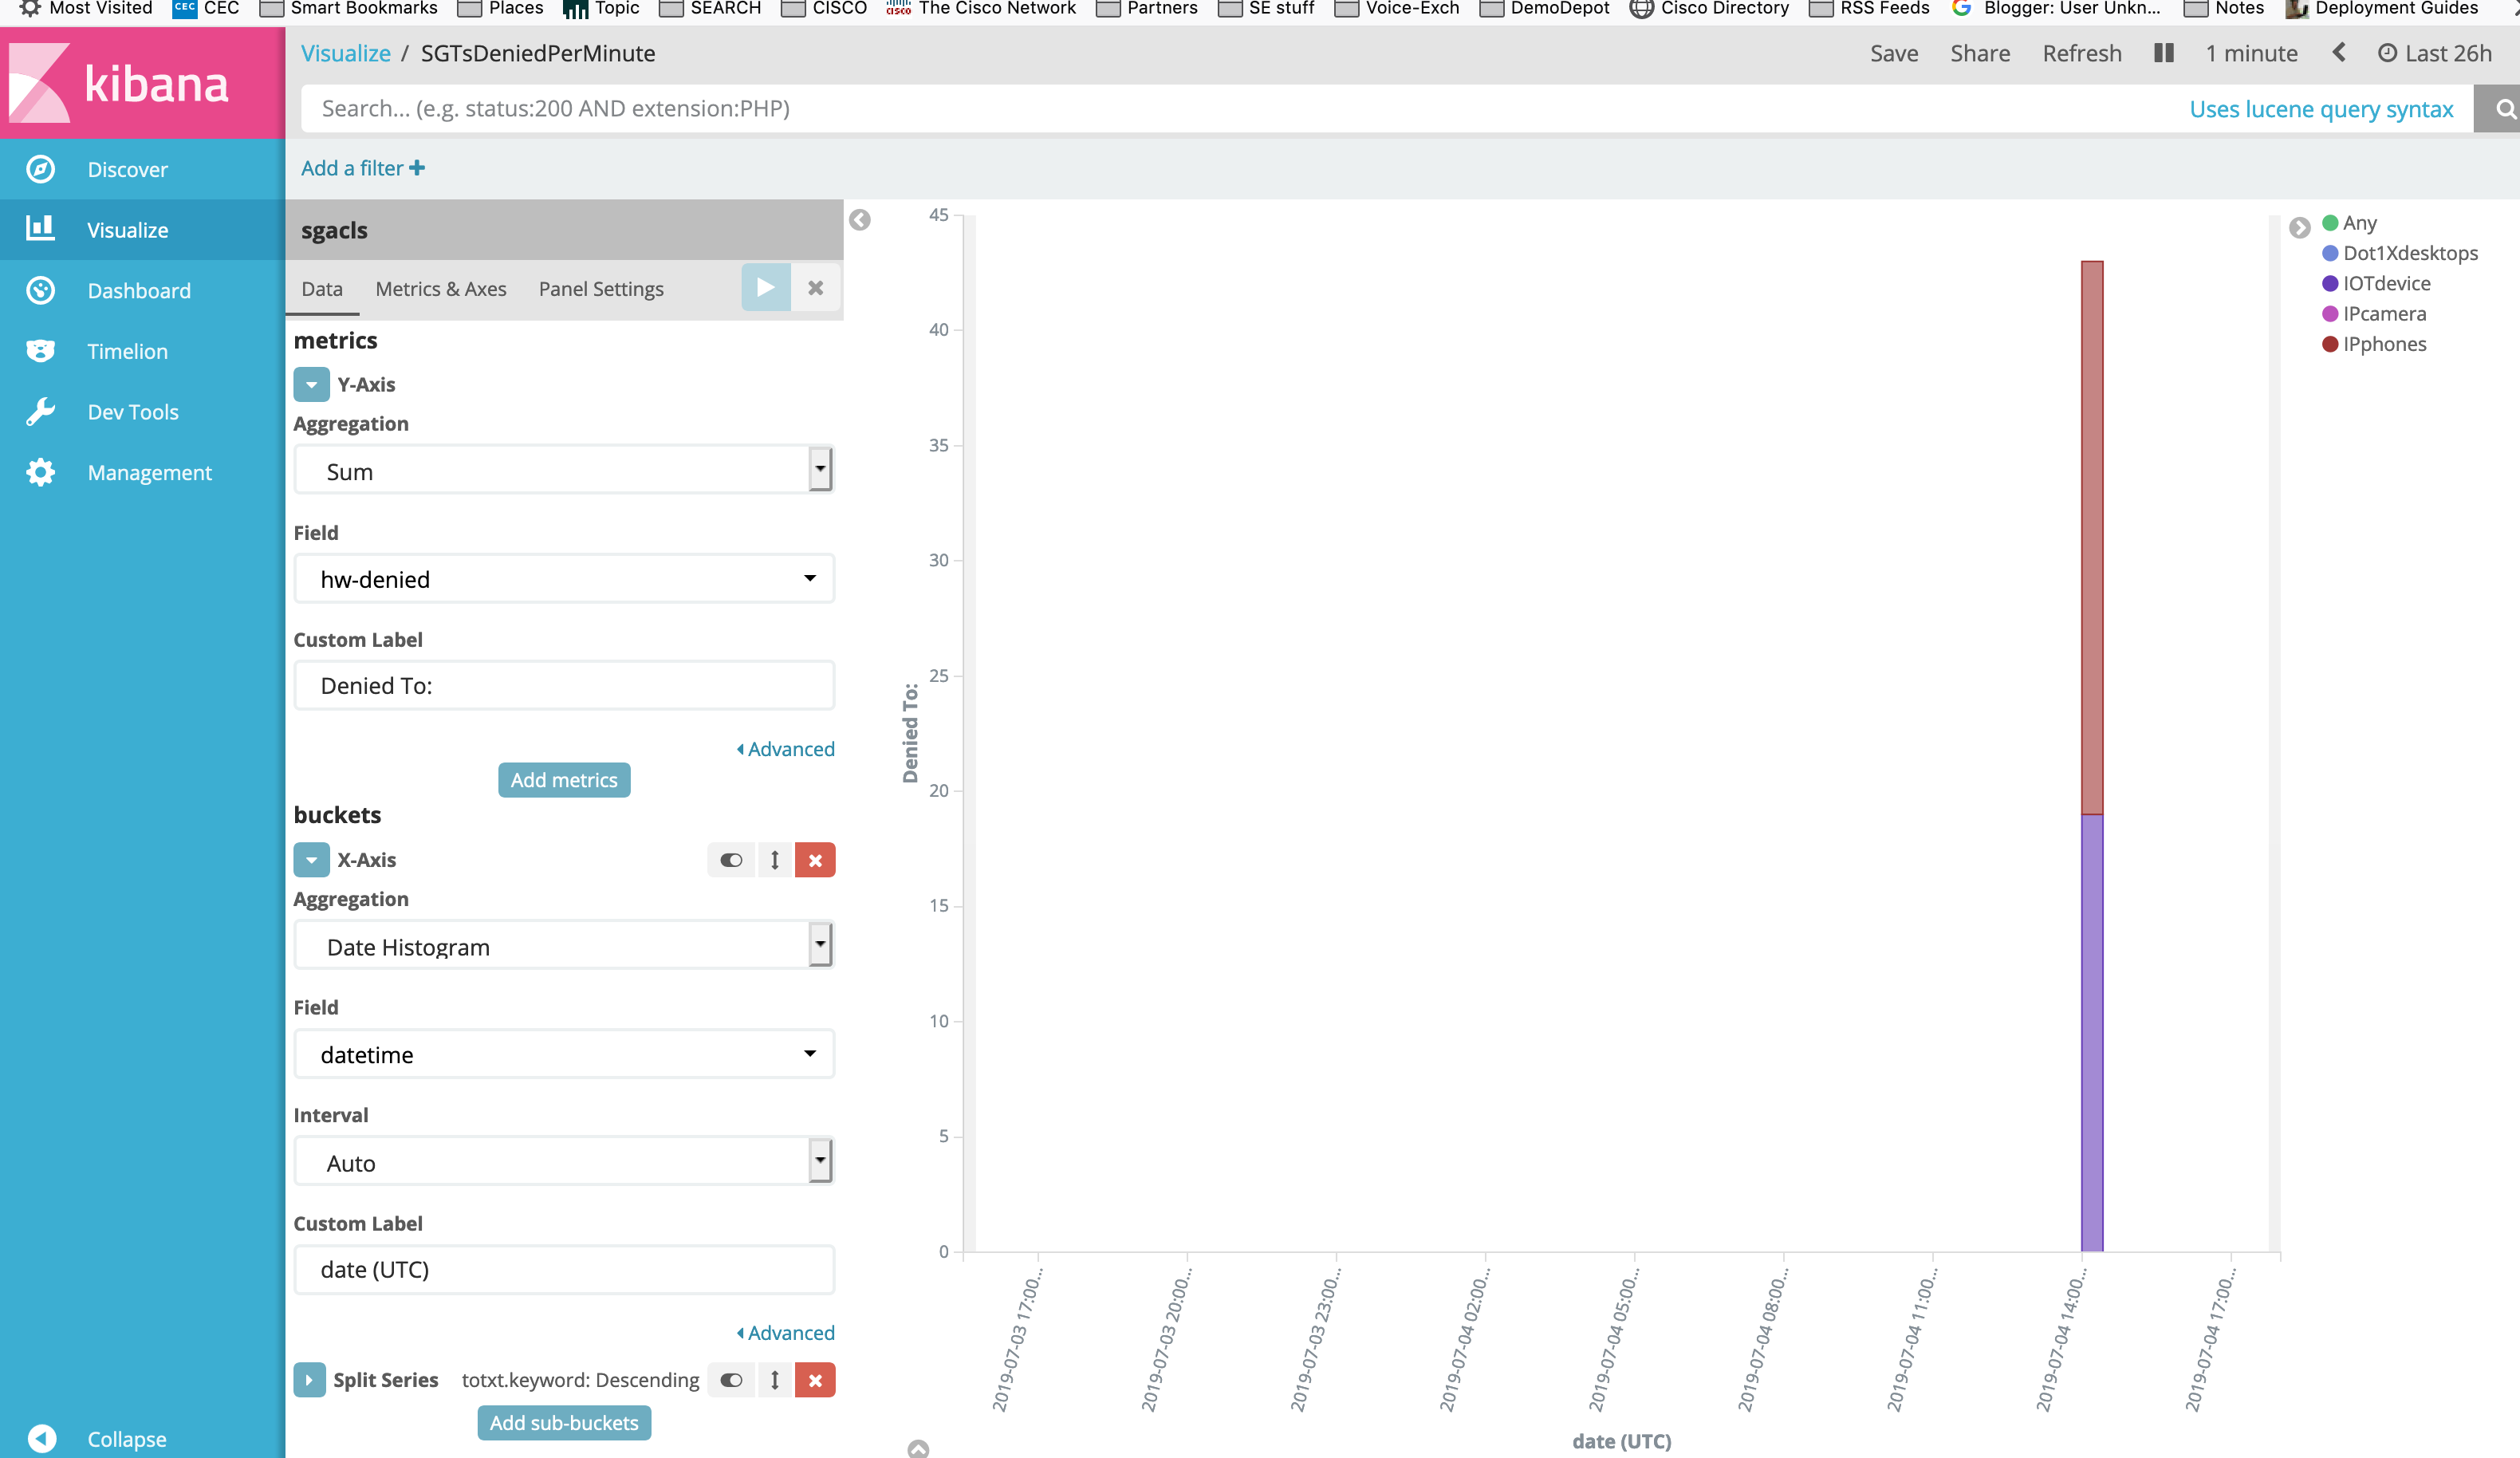
Here, we have four dashlets, two with the “Pie” type, and two with the “vertical bar” type (we will specify histogram as the X-axis). You can aggregate several counter field values as a sum (Y-axis). If you want to differentiate the Y values based on a specific criteria, choose the “Split series” sub-menu.
It’s up to you to create as many dashlets as you want and to group them in a single “Dashboard”.

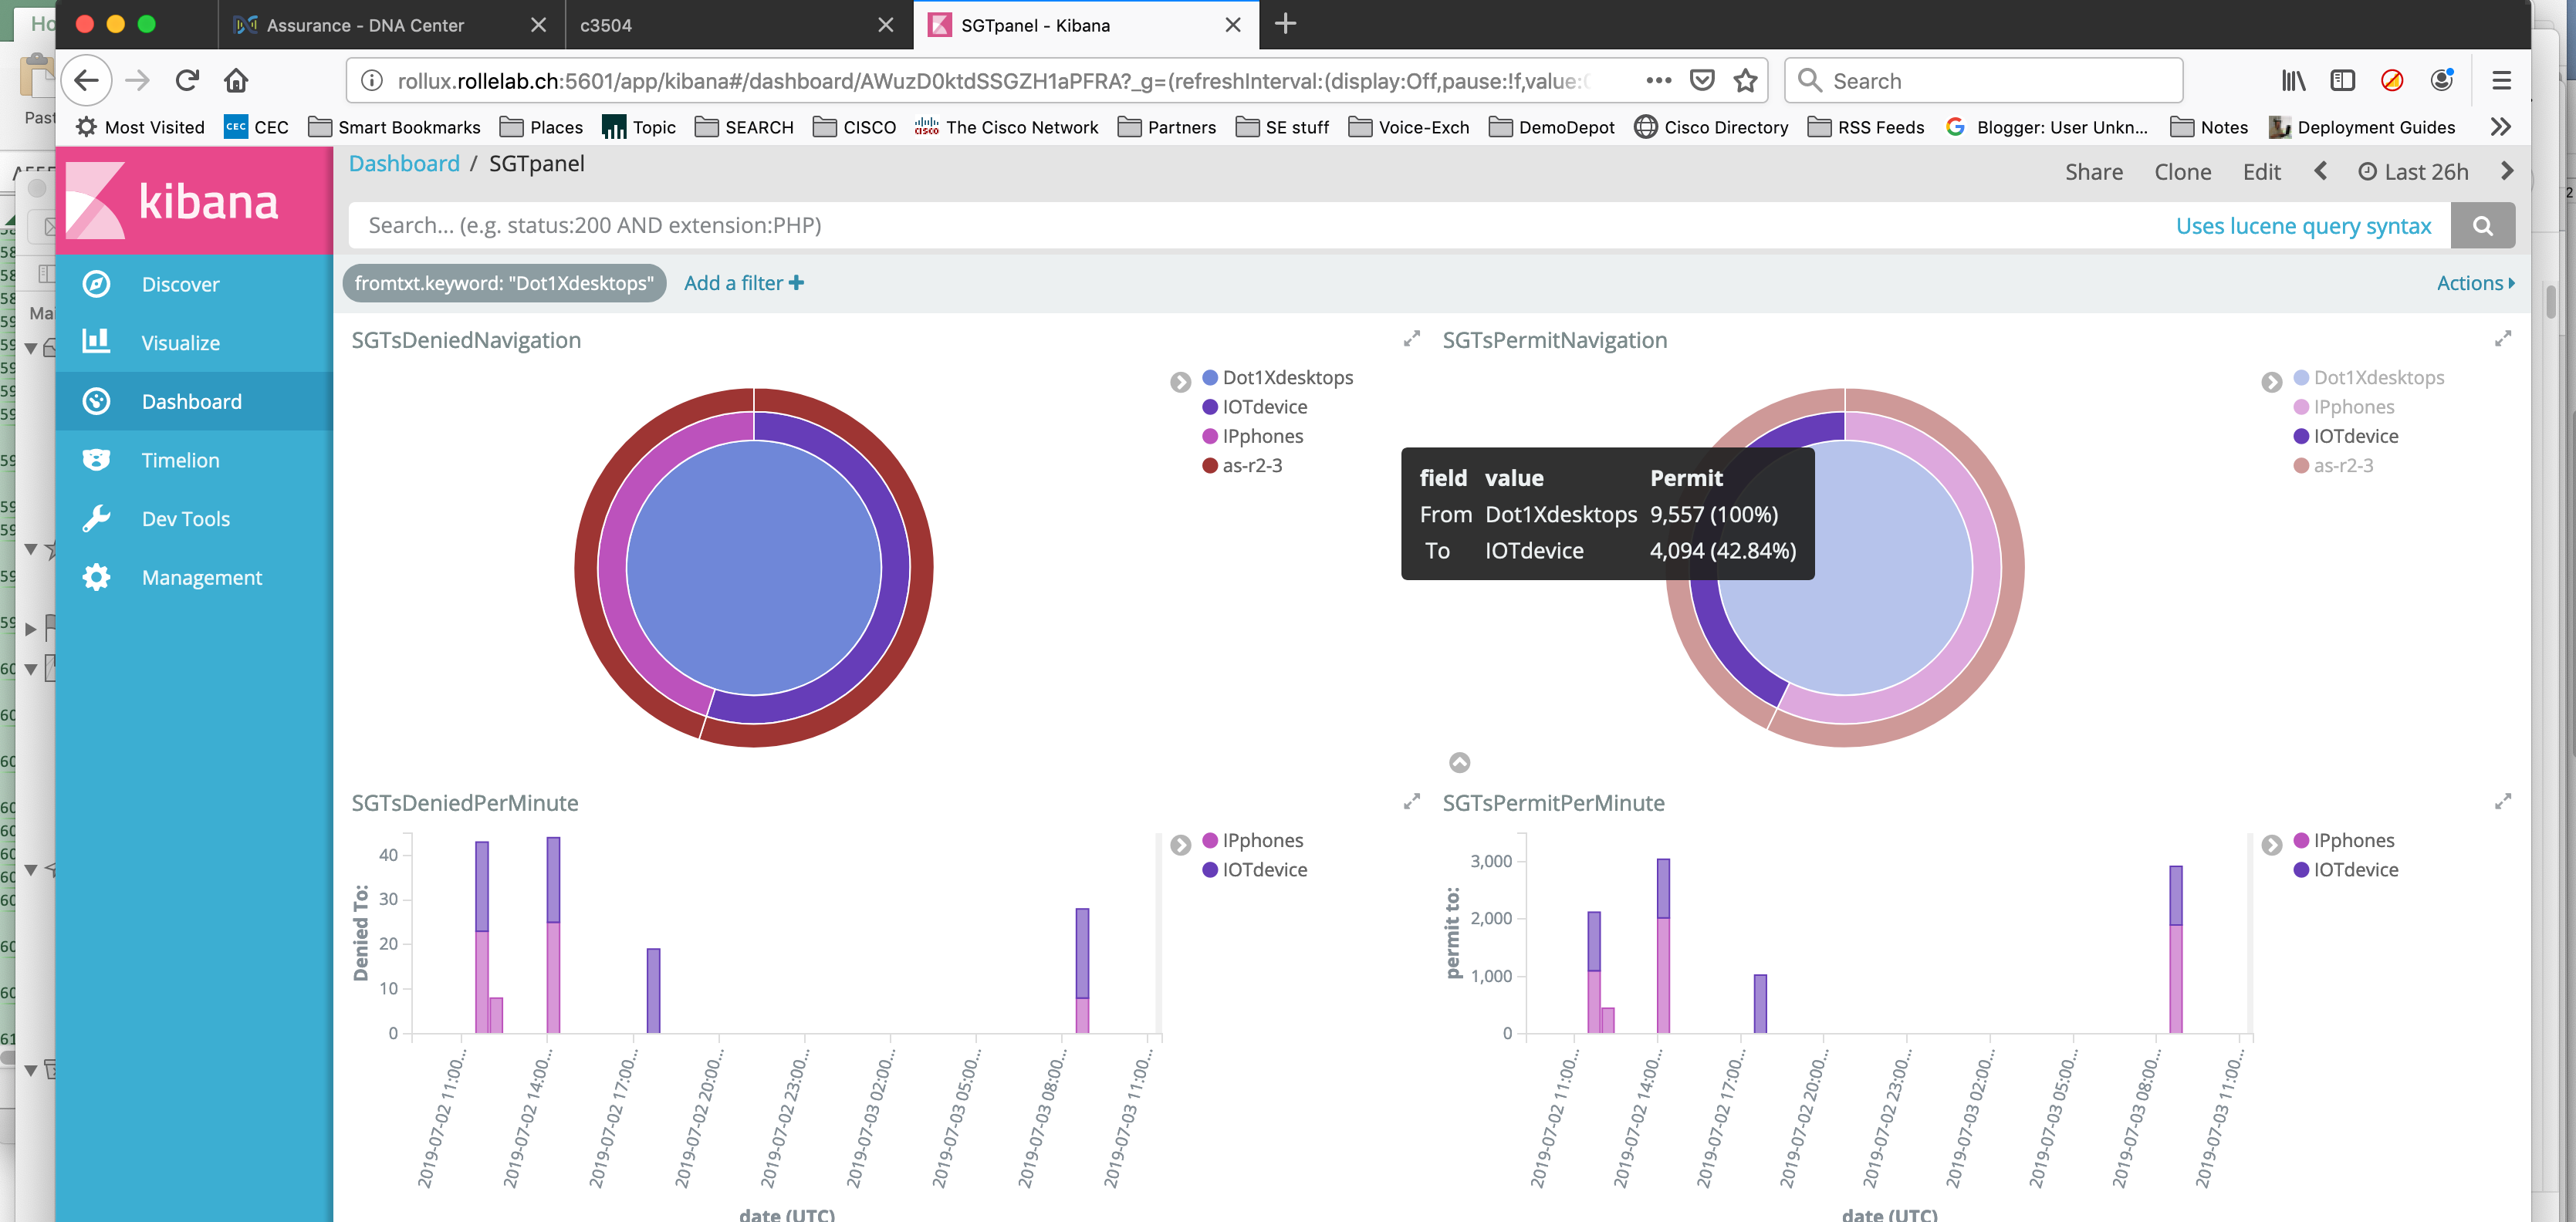
Now we have a dashboard with four dashlets :
- two pies with the number of denied and permitted flows based on the source Tag, destination Tag and switch
- two timelines with the number of denied and permitted Tags split by destination Tag
The additional benefit is that any filter you can set by clicking on a particular area will apply on all dashlets simultaneously; And if you would like to focus on a particular period of time, you can adjust the time range, and eventually when set as relative, the refresh interval.
Conclusion
We have seen how to schedule, process and display operational values in order to monitor a Trustsec enabled network by using open and flexible tools.
This is only one example of the large spectrum of customisations and automation add-ons you may envisage to deploy in your network to help you every day …
If you want to discover more, there is definitely one place to visit : https://developer.cisco.com!
Authors