
Want to see how you can get started with a customisable, operationalizable monitoring strategy? This is the blog for you!
Monitoring all aspects of IT infrastructure is important. Throw in a mass exodus from the office to home working alongside and an industry shift to a more diverse IT operational model with cloud-native technologies and the adoption of SaaS applications, a solid all-encompassing monitoring strategy is mission critical.
The ability to gather data from every inch of your IT estate sounds like a big ask, but this is easier than ever. With the advent of community-driven open-source monitoring technology, alongside new smarter ways to extract data from infrastructure it is possible to get up and running within a matter of hours.
What technology to use?
There are lots of different technology stacks available, both open source and paid-for options. But generally speaking, you’ll need 3 components, a database (this is usually a time-series database), a data-gathering solution to connect to devices and retrieve telemetry data from them, and a data visualisation tool.
A few of the more common technology stacks that provide all three elements in one neat package are:
- ELK – Elastic search, Logstash, Kibana
- TIG – Telegraf, InfluxDB, Grafana
- Splunk
- Prometheus, Grafana
The 3 stages of Telemetry
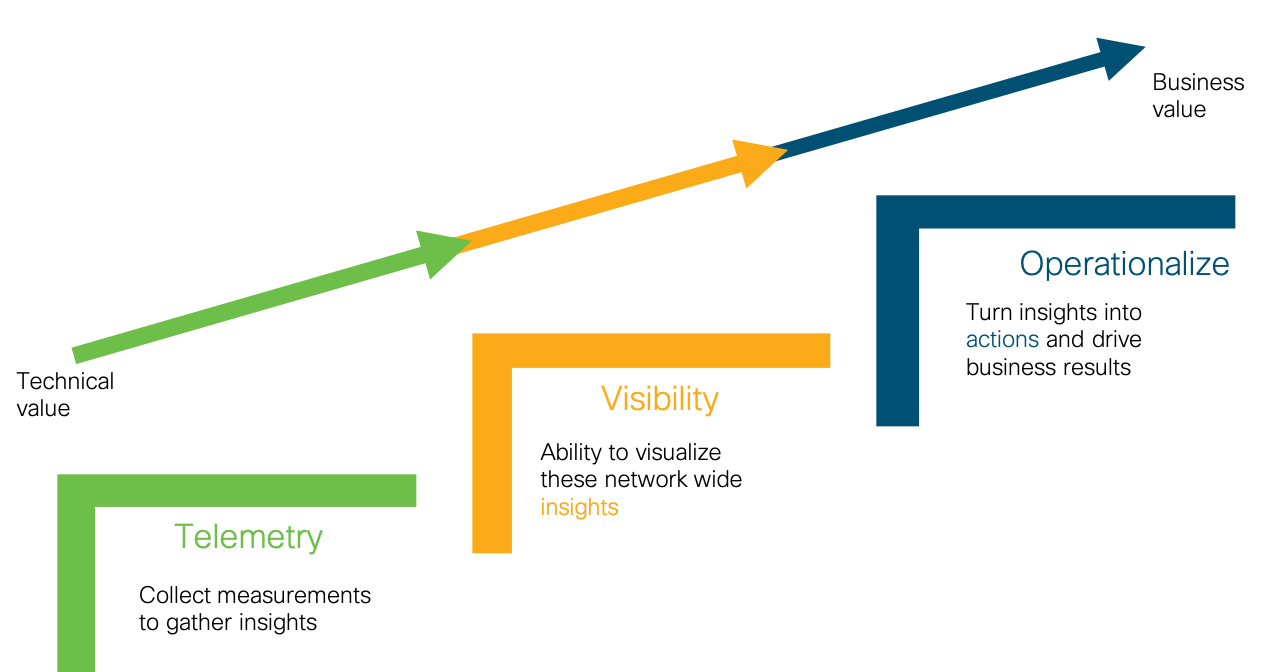
When I think of telemetry, I find it useful to split it up into three different elements, collecting and storing data, visualising the data, and operationalising the data.
Click to view full image
1 – Collecting and storing telemetry data
The first thing you need to do is gather the data and store it somewhere. The chances are that whichever telemetry technology stack you choose will include a way to gather data using pre-built modules for lots of different connection and device types, and it will also include a database.
When it comes to gathering the data from devices, there are different ways to do it depending on what type of device you are connecting to.
REST API
If you have a controller-based system that you want to collect data from, such as DNA Centre or ACI, or a cloud-based solution like AppDynamics or Thousand Eyes, the easiest way to gather data is by making automated periodic API calls.
This will give you the data in a structured format that is easy to then put into your database of choice.
Streaming Telemetry
If you want to collect data directly from a device, such as a router or switch, the easiest way is to use streaming telemetry. Streaming telemetry is a relatively new technique that allows a data collector to subscribe to a data stream sent by the device. This allows much more frequent data collection intervals, giving near-real time data, while having a smaller overhead on the network than older techniques like SNMP polling.
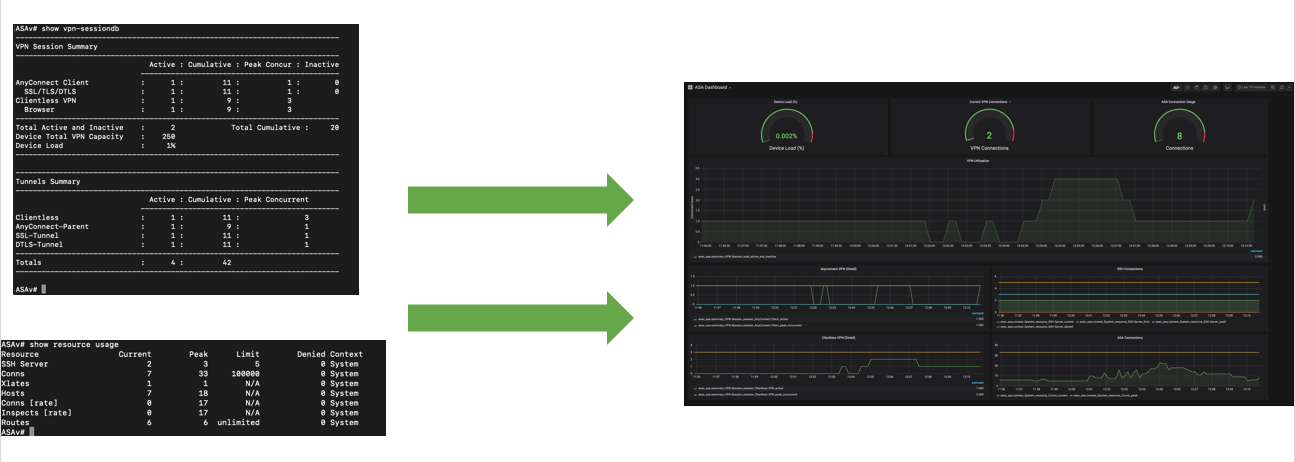
CLI Scraping
If you have a device that doesn’t support more modern options for collecting data like REST APIs or streaming telemetry, you can still gather the data using CLI scraping.
CLI scraping is when you programmatically connect to a device, run a series of CLI commands to make the device display the telemetry data you want in text format, and then automatically parse the text output to extract the telemetry data and convert it into a machine-readable structured data format like JSON, XML or YAML.
Click to view full image.
2 – Visualising the data
Once you are collecting the data and storing it, you want to start to gain value from the data you’ve collected by visualising it.
As I mentioned before, there are a number of different solutions you can use to visualise the data. Generally, you can do similar visualisations in whichever tool you choose.
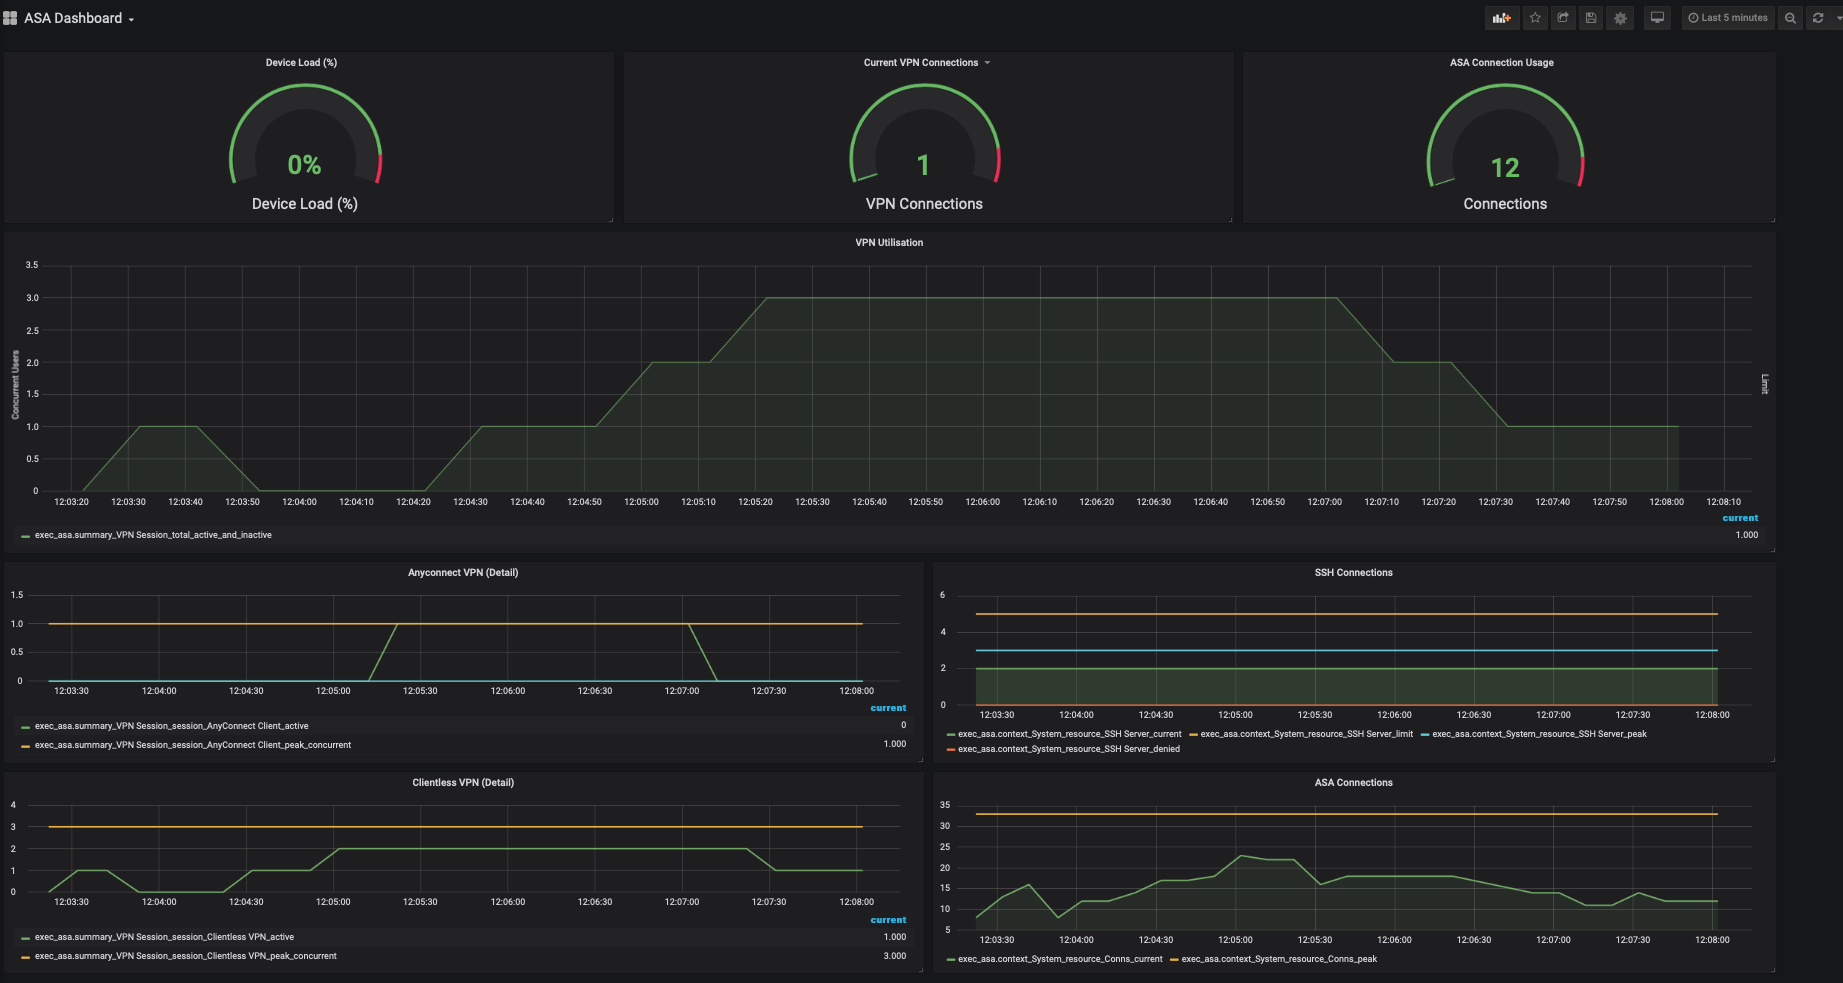
You can create different dashboards to show different things, along with showing a different level of detail in the data. For example, you will probably want a dashboard that gives an overview of all your infrastructure in one view, allowing you to look and instantly see any issues highlighted in red.
This is useful for when you want a quick overview of infrastructure health, but when it comes to diagnosing the issue you will want to access more data, so a second set of dashboards is useful that provides a much deeper view of the data and allowing you to drill down into historical time periods to see what and when issues happen to speed up diagnostic efforts.
You might want another set of dashboards that provide very granular detail into each element of your infrastructure to aid in development, optimisation and future capacity planning efforts.
3 – Operationalising the data
Finally, when it comes to getting the most value out of your telemetry you can start to operationalise your data. This can mean getting creative!
A simple way to start is to build automated pre-emptive alert systems to notify the correct people when something might need attention, e.g., when VPN capacity is close to maximum capacity.
You can even start to tie this data in with auto-scaling systems to ensure there’s always enough capacity in your cloud infrastructure.
I’ve even seen customers use connection data from wireless networks to monitor the number of people in a building to ensure social distancing measures are being observed!
What about Cisco Telemetry Insights?
Many products at Cisco have superb, advanced monitoring and telemetry solutions already built into them. A few notable examples are Nexus Dashboard, AppDynamics and ACI.
Often this can be more than enough for your needs, however sometimes you want a centralised single point to view data from all your different IT infrastructure elements. This allows you to cross-reference data from the whole IT estate which provides more value than if the data is kept separate. A perfect example of ‘the whole is greater than the sum of its parts’.
The good news is that if you want to do this, you can let your Cisco solutions do all the heavy lifting!
One of the biggest challenges with telemetry is building a system that can analyse the telemetry data with consideration for the context in which the data is relevant. Pulling thousands of different data points is overwhelming but pulling a single health score that has already taken account of all the telemetry available is far more useful. So, with Cisco telemetry, you can easily pull simplified contextual data into your new centralised telemetry solution rather than the raw data which is often overwhelming and difficult to gain actionable insights from.
Where to go from here?
I hope you’ve found this introduction useful. There are a lot of resources available to help you get started with telemetry, including guides with sample code on the DevNet code exchange.
Authors